

Four tiles, your requests by status, and all requests by status, with charts you can open.
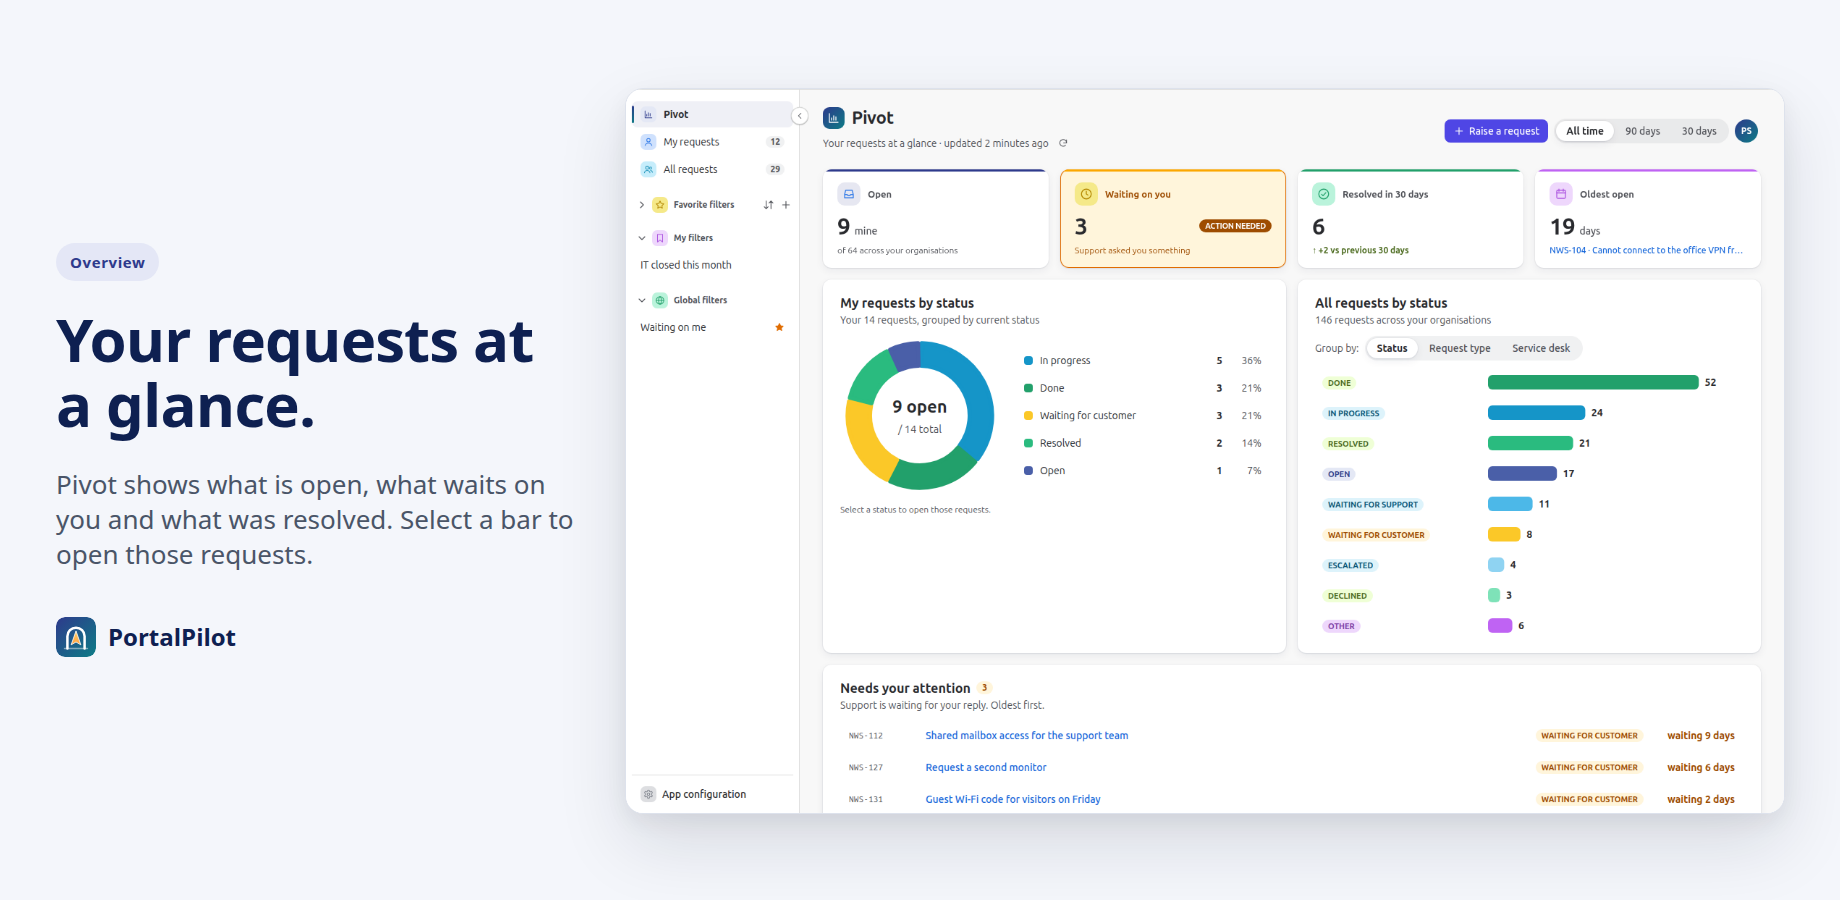
Pivot is the overview. It opens first unless your admin turns it off or chooses another start page. It shows your own requests and all the requests you may see.
The four tiles
- Open: your open requests, with the open total of all requests you may see.
- Waiting on you: your open requests in a status that means support is waiting for your reply. Your admin chooses those statuses; by default it is any status whose name contains “customer”. The tile is amber when the count is above zero. Select it to open those requests.
- Resolved in 30 days: how many of your requests were resolved, compared with the 30 days before.
- Oldest open: how many days your oldest open request has been open. Select its key to open the request.
Charts
- My requests by status: a donut of your requests. Select a status to open those requests.
- All requests by status: bars for all requests. Use Group by to group them by Status, Request type or Service desk. Select a bar to open those requests.
- Time range: All time, 90 days or 30 days. The range changes the Open tile and the charts. Lists opened from a chart show requests from all dates.
- Refresh reads the numbers again.
Needs your attention
Lists up to five of your requests that are waiting for your reply, oldest first. When there are more, select View all to open the full waiting list.
Limits
Charts count up to 1,000 open and 1,000 closed requests in each set. When a count is capped, a note says “Showing the first 1,000 requests”.
Related pages
Need help with PortalPilot? Contact us