

Both editions include five widgets for Jira's own dashboards: Filters, Chart, List, Time in Status and Calendar. Each one reads Jira as the person looking at the dashboard, so everyone sees only the work items Jira already lets them see.
Add a widget to a classic dashboard
- Open a Jira dashboard and choose Edit, then Add gadget.
- Search for "SmartDash" and add the gadget you want.
- A new gadget says Set up this gadget. Open the gadget's menu and choose Edit.
- The Configure window opens, with tabs on one side and a live preview. Change what you like and choose Save. Cancel or Esc closes it without saving.
Settings are saved by Jira with the gadget on that dashboard, like any Jira gadget's settings. The gadgets fit one, two or three column layouts.
Add a widget to a new dashboard
Jira's new dashboards hold widgets, not gadgets. SmartDash has the same five as widgets, with the same settings. Find them in Jira's widget picker by searching for SmartDash.
- Old gadgets are not offered on a new dashboard. Dashboards that already have SmartDash gadgets keep them.
- Set up a widget. A new widget asks to be set up until you do. Open its menu and choose Edit.
- Settings open in Jira's edit panel, in one column with the tabs across the top. Jira draws a preview beside the panel, and it follows your changes.
- Saving. Use Jira's own button at the foot of the panel. It says Add when you are adding the widget. Then reload the dashboard to see the widget's real data.
- Fixed height. A widget's height is the slot Jira gives it. A List scrolls its rows inside the widget, with the headings kept at the top. A Time in Status chart scrolls its bars inside the widget.
The filter row of a new dashboard
Jira's new dashboards can show a filter row above the widgets. A SmartDash widget can follow it.
- Dashboard is the first choice under Source on a Chart, List, Time in Status or Calendar widget. Its search then follows what is picked in the row, and it updates at once when the row changes.
- The subtitle names the spaces it searches, for example "Dashboard filters: Website Team", so two widgets on one page can be told apart.
- What is read. The space (read as a project), status, assignee, work type, priority, label, reporter, status category and the updated date are read, along with other fields by name. Only is and is not are read as comparisons.
- Request type is not applied. Jira's row gives a request type in a form a search cannot use, so the widget's subtitle says Not applied here: Request type.
- Filters it cannot read are left out, never guessed. The subtitle says Not applied here: and names them.
- Nothing picked. If no filter in the row has a value, the widget says "Choose a filter at the top of this dashboard."
- A widget with its own source ignores the row. A widget whose source is Projects, Saved filter or JQL keeps its own search.
- Picks last for one visit. A page reload clears the picks in the row.
The Filters widget is still useful on a new dashboard for its one-click tabs, text search, Order by and result count. Other widgets follow it only when their source is Filters.
Choose where the work items come from
Every widget has a Source tab, "Where the work items come from":
| Choice | What it does |
|---|---|
| Filters | Follows a Filters widget on the same dashboard. When a viewer changes a filter there, this widget updates too. |
| Projects | One or more projects, picked from a list with search. |
| Saved filter | A Jira saved filter, found by name. |
| JQL | Your own JQL, up to 2,000 characters. Jira runs it as the viewer. |
A widget added to a dashboard that already has a Filters widget follows it at first. If the dashboard has more than one, pick one under Which Filters gadget. If the dashboard has none, Filters is greyed out.
Filters
A search bar for the whole dashboard, with chips, a text box, a date range and up to 6 tabs. Chart, List, Time in Status and Calendar can all follow it. See The Filters widget.
Chart
Pie, bar, grouped and stacked bar, line, funnel, table and tiles, by any field you can group on, with goal lines, target bands and colour rules. See The Chart widget.
List
A table of work items with up to 8 columns, up to 8 quick filters, pages of 10 to 100 rows and Export as CSV. See The List widget.
Time in Status
How long work spent in each status, per status, per work item, per person or per group, what is stuck now, and cycle or lead time as a trend. See The Time in Status widget.
Calendar
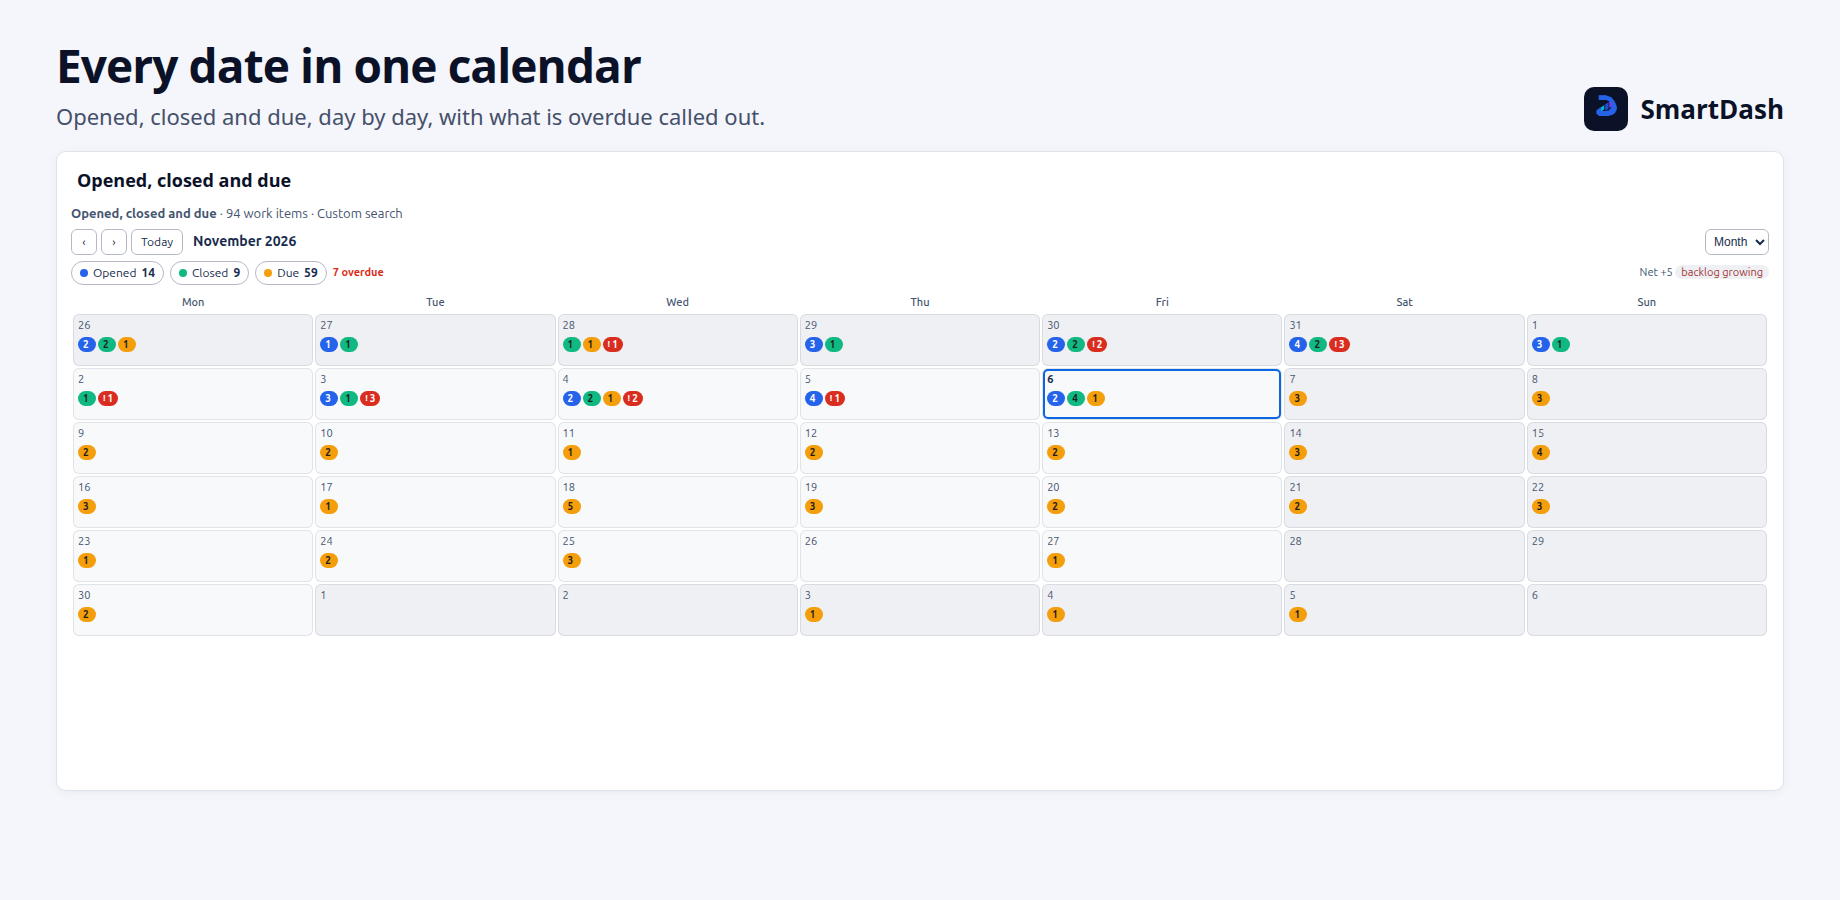
Work items on the days they happened, in up to 6 layers, with SLA layers for service projects and a net layer that reads as a backlog. See The Calendar widget.
Limits and messages
When a limit applies, the widget says so:
- "First 500 work items": Time in Status views, other than Per work item, read up to 500 work items and their histories.
- Calendar over 2,000 work items: a layer with more than 2,000 work items uses Jira's own count for each day, which can be a little off, and the widget says so. When a layer cannot be counted that way, the widget says Only the first 2000 work items were read, and that layer's numbers are too low. Narrow the source.
- Charts count exactly up to 10,000 work items. Above that, Jira's estimate is used and labelled as one.
- "Some histories were too long to read in full.": a few work items have very long change histories.
A widget reads Jira only while it is on screen. For every limit in one place, see What to expect.
Need help with SmartDash? Contact us