

The Chart widget counts, sums or averages the work items of its source and draws them as a pie, bars, a line, a funnel, a table or tiles. It is in both editions, on classic and new Jira dashboards, with the same settings in each place.
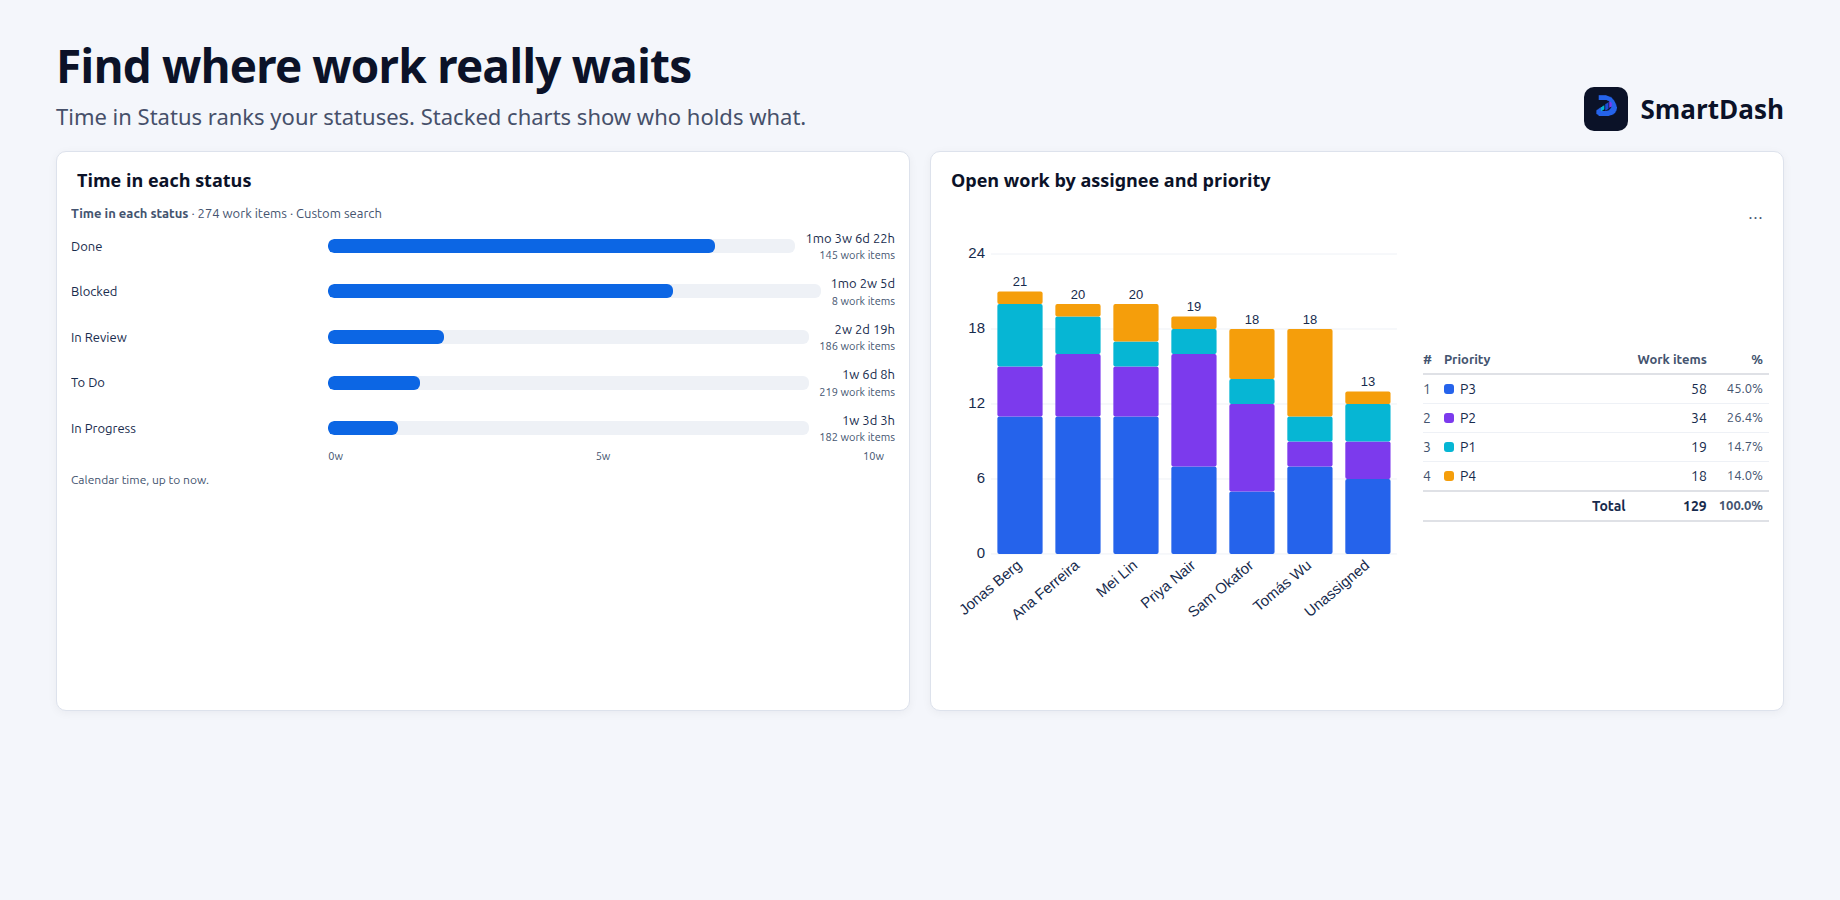
Chart types
Pie, Bar, Grouped bar, Stacked bar, Line, Two-level line, Funnel, Table, Two-level table and Tiles. Grouped bar, Stacked bar, Two-level line and Two-level table have two levels.
A new chart starts as a donut pie with a table legend showing the number and the share. A legend longer than 5 lines folds, and +N more opens the rest.
Data
- Chart by any field you can group on, or Time in status. Date fields can be grouped by day, week, month, quarter or year.
- Group by a second field, on two-level types.
- Compare dates: compare two to four date fields, such as Created and Resolved, on one time axis. It counts work items only. A work item counts in a field only when that field has a date.
- Measure: a count of work items, the sum or average of a number field such as Story Points, a calculation between two fields, or progress (one field out of another).
- Chart by Custom JQL: each bar, slice or row is its own search, added to the source. Up to 30 segments are shown, and up to 60 are kept in all, hidden ones included. Hidden segments are not read.
- Group by Custom JQL (two-level types): up to 8 parts are shown. Custom JQL cannot be used for both levels at once.
- More options: cumulative total, count each work item once, and up to 6 goal, average and trend lines.
Target bands
A target band is a shaded range across a bar or line chart, for example from 100 to 200. Under More options, choose Add target band. You can add up to 3. Each band has a from and a to number, a name (up to 40 characters) and a colour. A band is not saved until its first number is below its second.
Notes on a line chart
A note is a dated marker with a short text, such as "release 4.2", on a line chart whose axis is dates. Under More options, choose Add note. You can add up to 10. A text can be up to 60 characters, and a label longer than 24 characters is shortened on the chart; hover over it to read it all. A note whose date is outside the chart is not drawn.
Segments and colours
- Sort parts manually, largest first or A to Z. Hide, recolour, rename or merge them.
- On a two-level chart split by a field, Colours of gives each value of the Group By field its own colour. Up to 60 values can keep a colour of their own.
Display
- Heading, legend, total row, percentages, count labels, tooltip, axis and gridline options, number and date formats, and 0 to 4 decimal places.
- Highlight makes one part stand out once it passes a count you set.
- Colour rules colour a bar when its number meets a rule, such as When the value is > 100. You can add up to 5, and the first rule that matches wins. Colour rules are not offered on a two-level chart, on Compare dates, or on a chart with extra columns.
- Percent of: on a two-level chart in percent, Total makes each part a share of the whole, and Row makes each row add up to 100%.
- Date window: on a chart over dates, choose All, Past 7 days, Past 30 days, Past 90 days or Between two dates. Every period in the window is drawn, and an empty one shows 0.
- Limit rows sets how many rows a table or tiles chart shows, from 1 to 100 (10 by default).
- Description: plain text of up to 500 characters, above or below the chart.
Tiles that compare two periods
On a Tiles chart, open Display, then Tiles, and choose Compare with an earlier period: the last 7, 30 or 90 days against the same number of days before them. Under Date to compare by, choose Created, Updated or Resolved.
Each tile adds a line such as ▲ 12 vs previous 7 days. ▲ means more work items in the last period, ▼ means fewer. The line has no red or green, because whether up is good depends on the chart. Turning the comparison on makes SmartDash read Jira two more times for the chart.
No line appears for a percent, progress or Time in Status chart, for a date tile, or for the Other tile. If either period cannot be read in full, no tile shows a change, and the chart says The two periods could not be read in full, so no change is shown.
Open, download and limits
- Open in Jira: click a bar, slice or row to open those work items in Jira in a new tab.
- Download: turn on "Allow download as CSV" to put the chart's numbers in the ··· menu.
- "N segments did not load in time": a Custom JQL chart reads up to 100 counts, or up to 50 segments that read work items. Hide the segments you do not need, or reload.
- "N segments show only the first 2,000 work items": a sum, an average or a split reads at most 2,000 work items for each segment.
- A segment whose search cannot be read shows its own message. The other segments still draw.
Need help with SmartDash? Contact us